安装的时候,我们使用的是 pkg 包安装的方式。
influxdb 的安装和配置
-
查找 influxdb 包
1pkg search influxdb搜索结果如下:
1
2
3
4
influxdb-1.8.10_14 Open-source distributed time series database influxdb2-cli-2.6.1_6 CLI for managing resources in InfluxDB v2 py39-influxdb-5.0.0_1 Python Client for InfluxDB rubygem-influxdb-0.8.1 Ruby library for InfluxDB -
安装
这里选用的是
influxdb-1.8.10_141pkg install influxdb-1.8.10_14 -
设置为随系统启动
1sysrc influxd_enable="YES" -
启动服务
1service influxd start -
修改 influxd 配置
配置文件的路径为
/usr/local/etc/influxd.conf,配置文件详细内容请看文档1vim /usr/local/etc/influxd.conf -
修改完成后重启服务
1service influxd restart -
设置要使用的databse以及用户名和密码
使用如下命令连接数据库
1influx添加数据库:
1CREATE DATABASE mydb查看数据库:
1SHOW DATABASES创建用户名和密码:
1CREATE USER username WITH PASSWORD 'password'
Grafana 的安装和配置
-
查找Grafana包
1pkg search grafana结果如下:
1
2
3
4
5
6
7
8
grafana-loki-2.7.4_2 Scalable, highly-available, multi-tenant log aggregation system grafana8-8.5.26 Dashboard and graph editor for multiple data stores grafana9-9.5.3 Dashboard and graph editor for multiple data stores icingaweb2-module-grafana-php80-1.4.2_1 Add Grafana graphs into Icinga Web 2 to display performance metrics icingaweb2-module-grafana-php81-1.4.2_1 Add Grafana graphs into Icinga Web 2 to display performance metrics icingaweb2-module-grafana-php82-1.4.2_1 Add Grafana graphs into Icinga Web 2 to display performance metrics py39-grafana-dashboard-manager-0.1.3 CLI for saving and restoring Grafana dashboards via HTTP API rubygem-aws-sdk-managedgrafana-1.13.0 Official AWS Ruby gem for Amazon Managed Grafana -
安装Grafana
我这里选用的安装版本为
grafana9-9.5.31pkg install grafana9-9.5.3 -
设置为系统启动
1sysrc grafana_enable="YES" -
启动服务,服务默认端口为
30001service grafana start -
登录服务
http://localhost:3000默认的账号密码为:
1
2
admin admin且登录后会要求修改密码,请务必使用强密码。
-
配置数据源
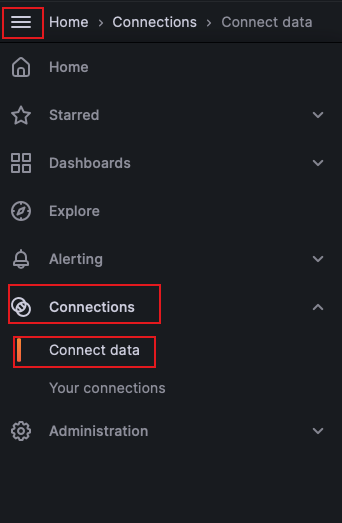
登录后点击左上角的 Toggle Menu -> 选择 Connections -> 选择 Connect data
在右边的输入框中输入
InfluxDB-> 选择搜索出来的 InfluxDB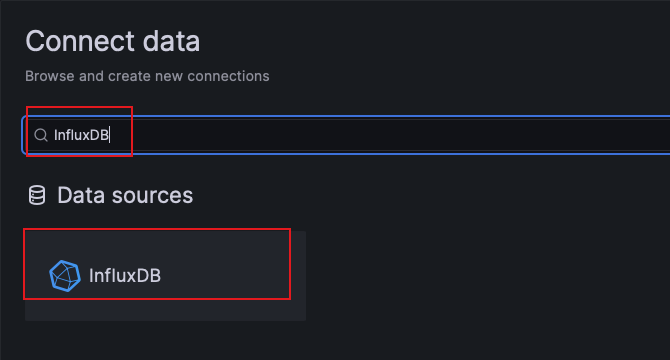
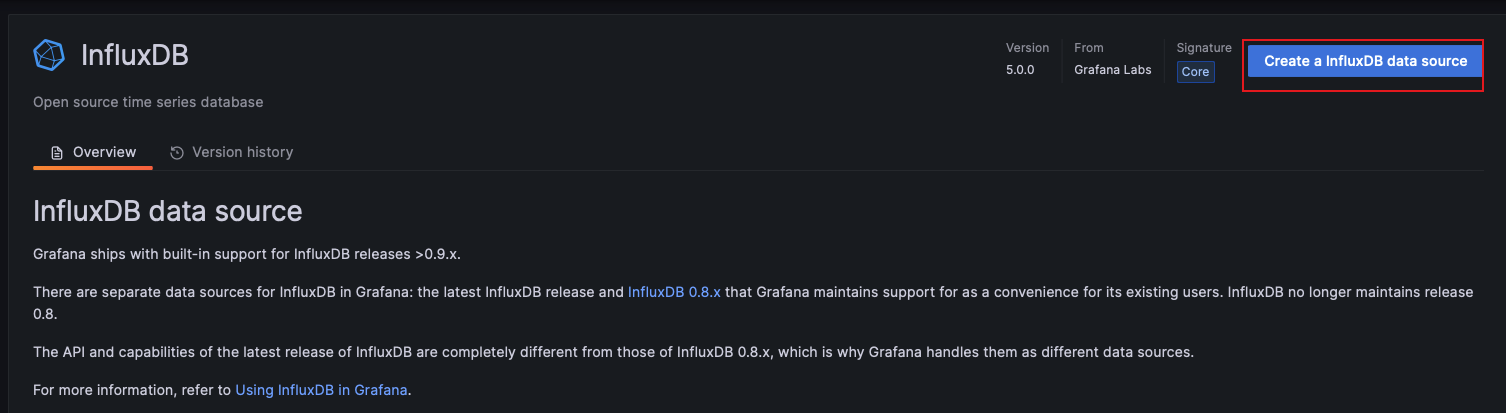
点击右上角的 Create a InfluxDB data source 按钮 -> 配置InfluxDB相关的内容。
在数据源配置页面填写相关的InfluxDB连接信息,需配置内容如下:
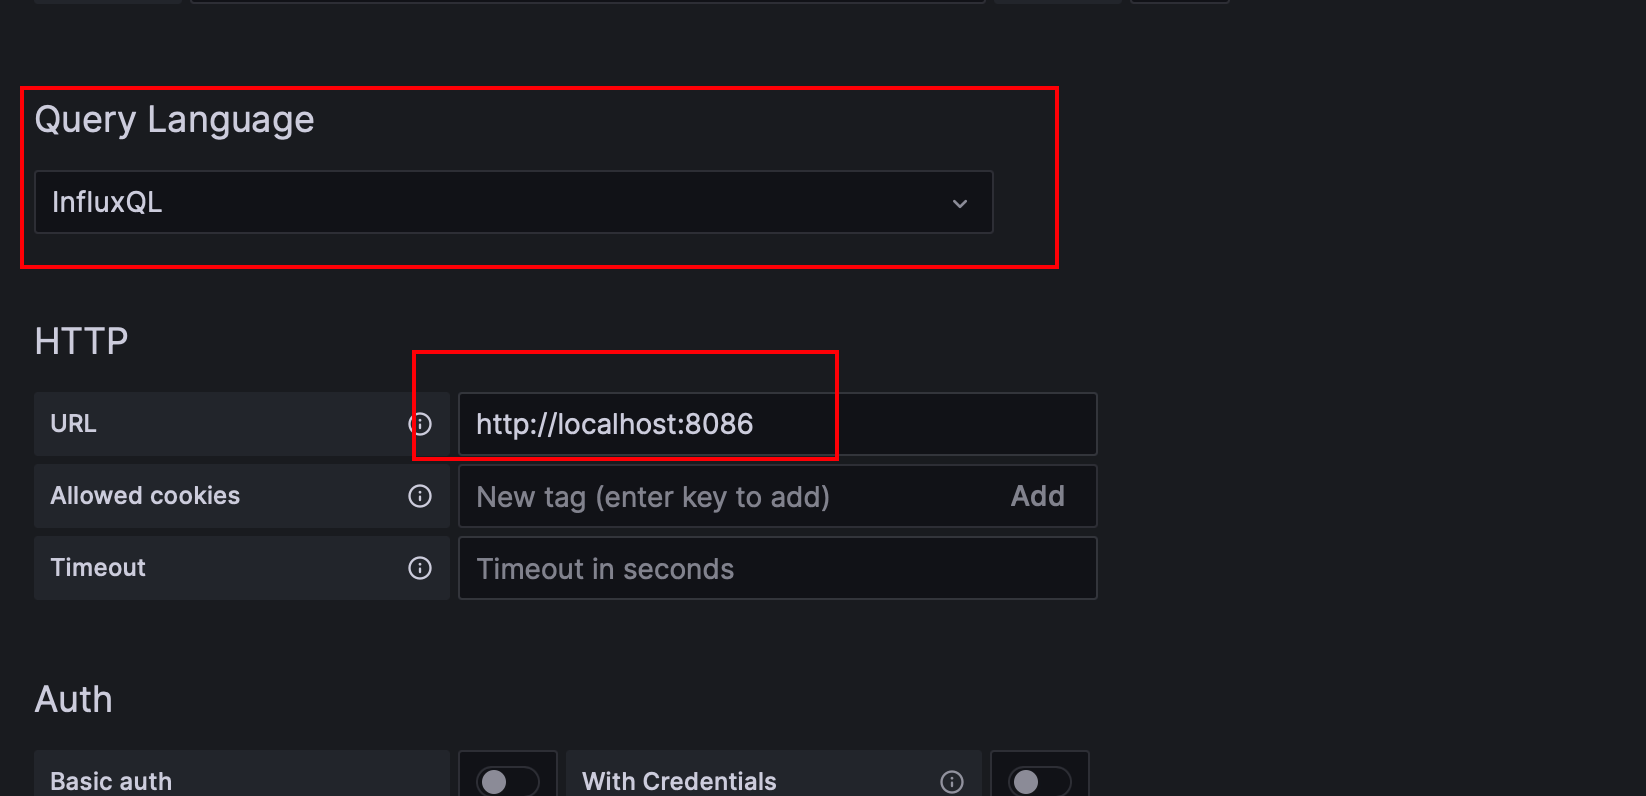
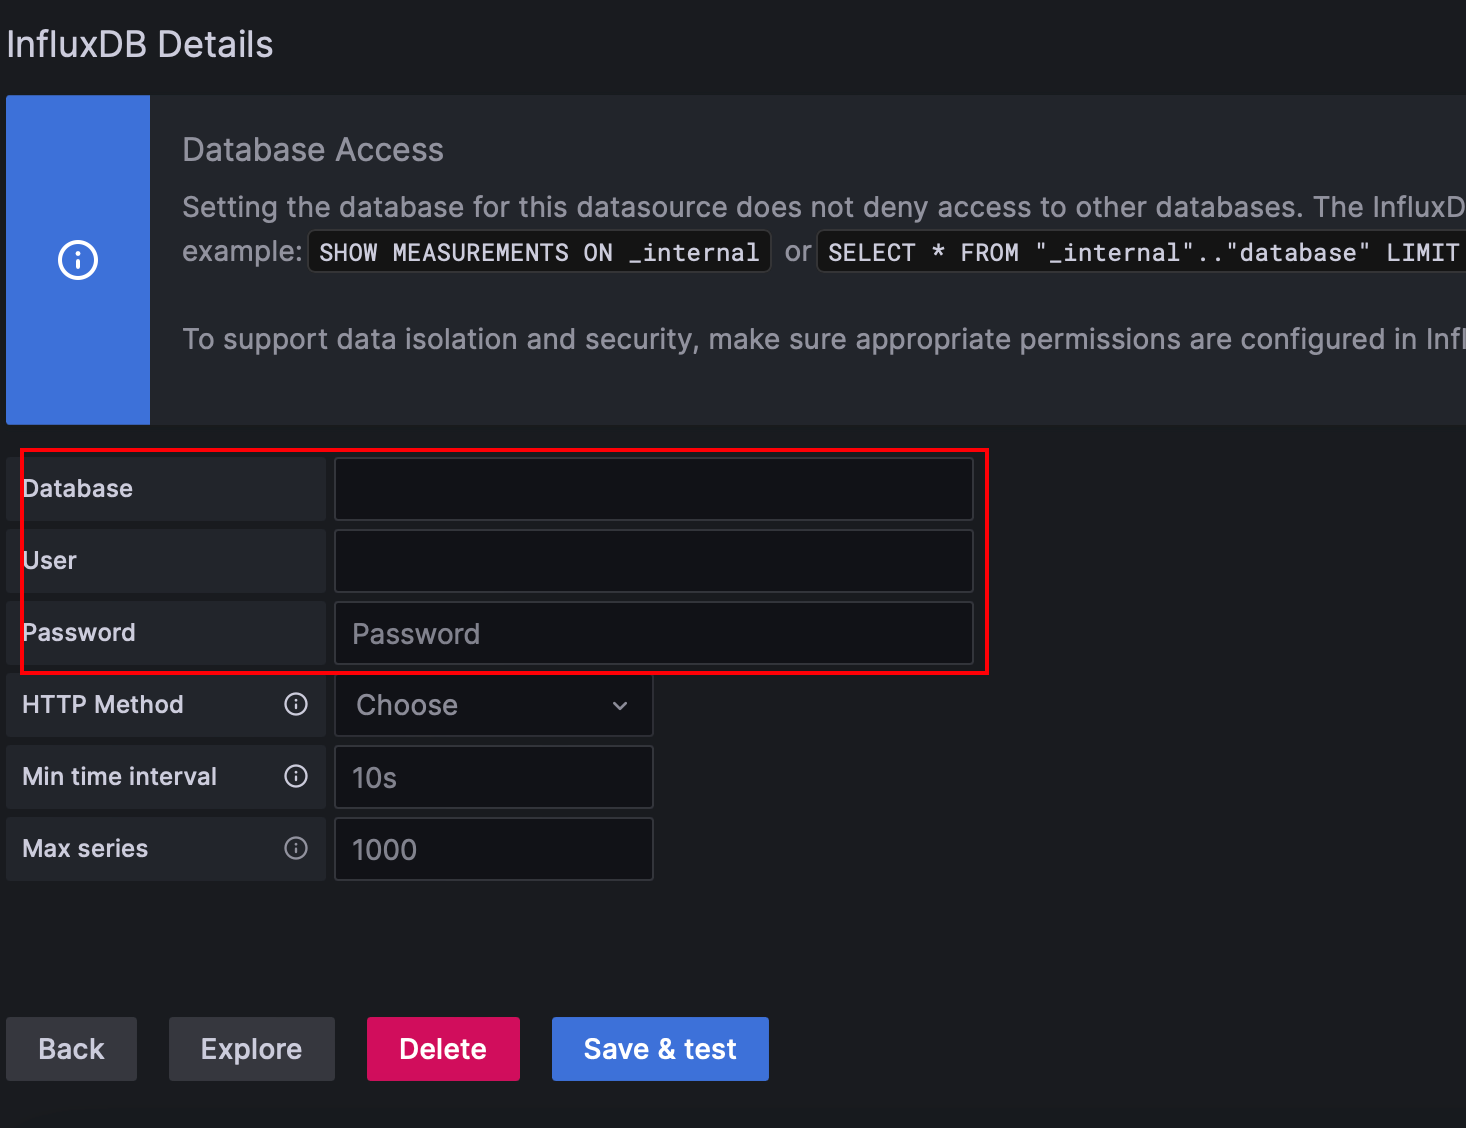
点击
Save & Test,显示如下弹窗则表示配置正确。 -
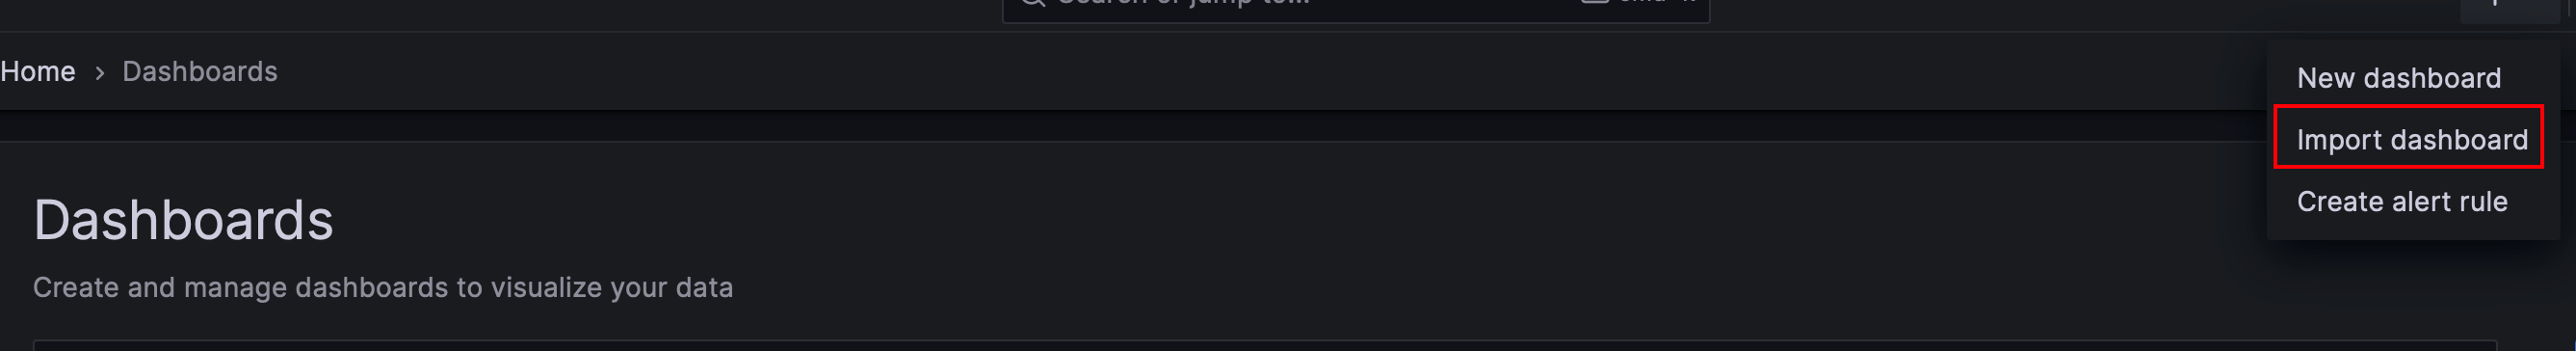
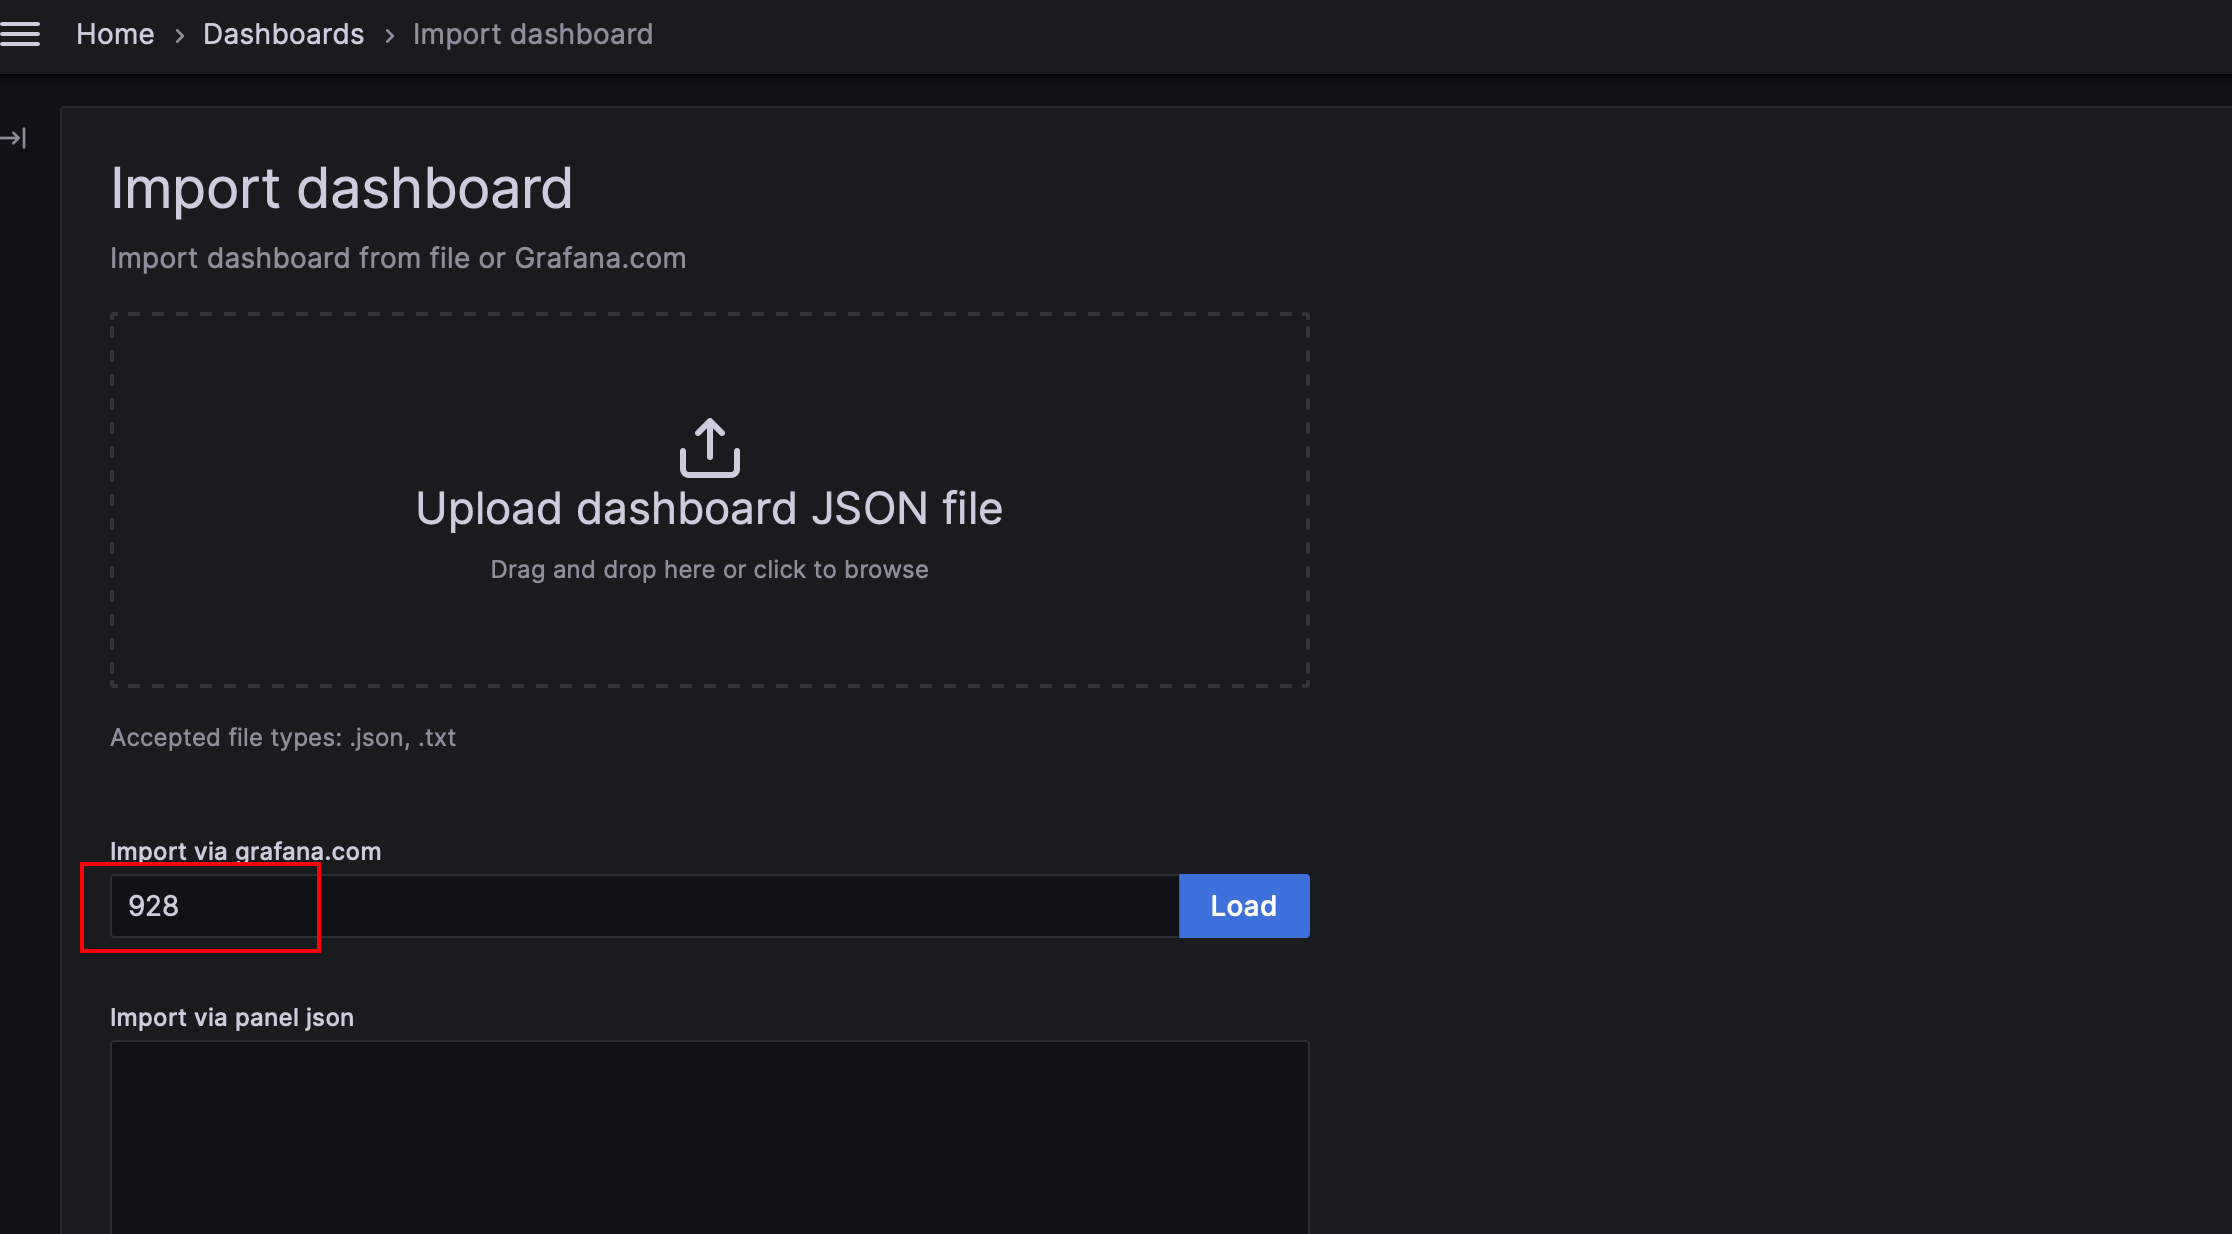
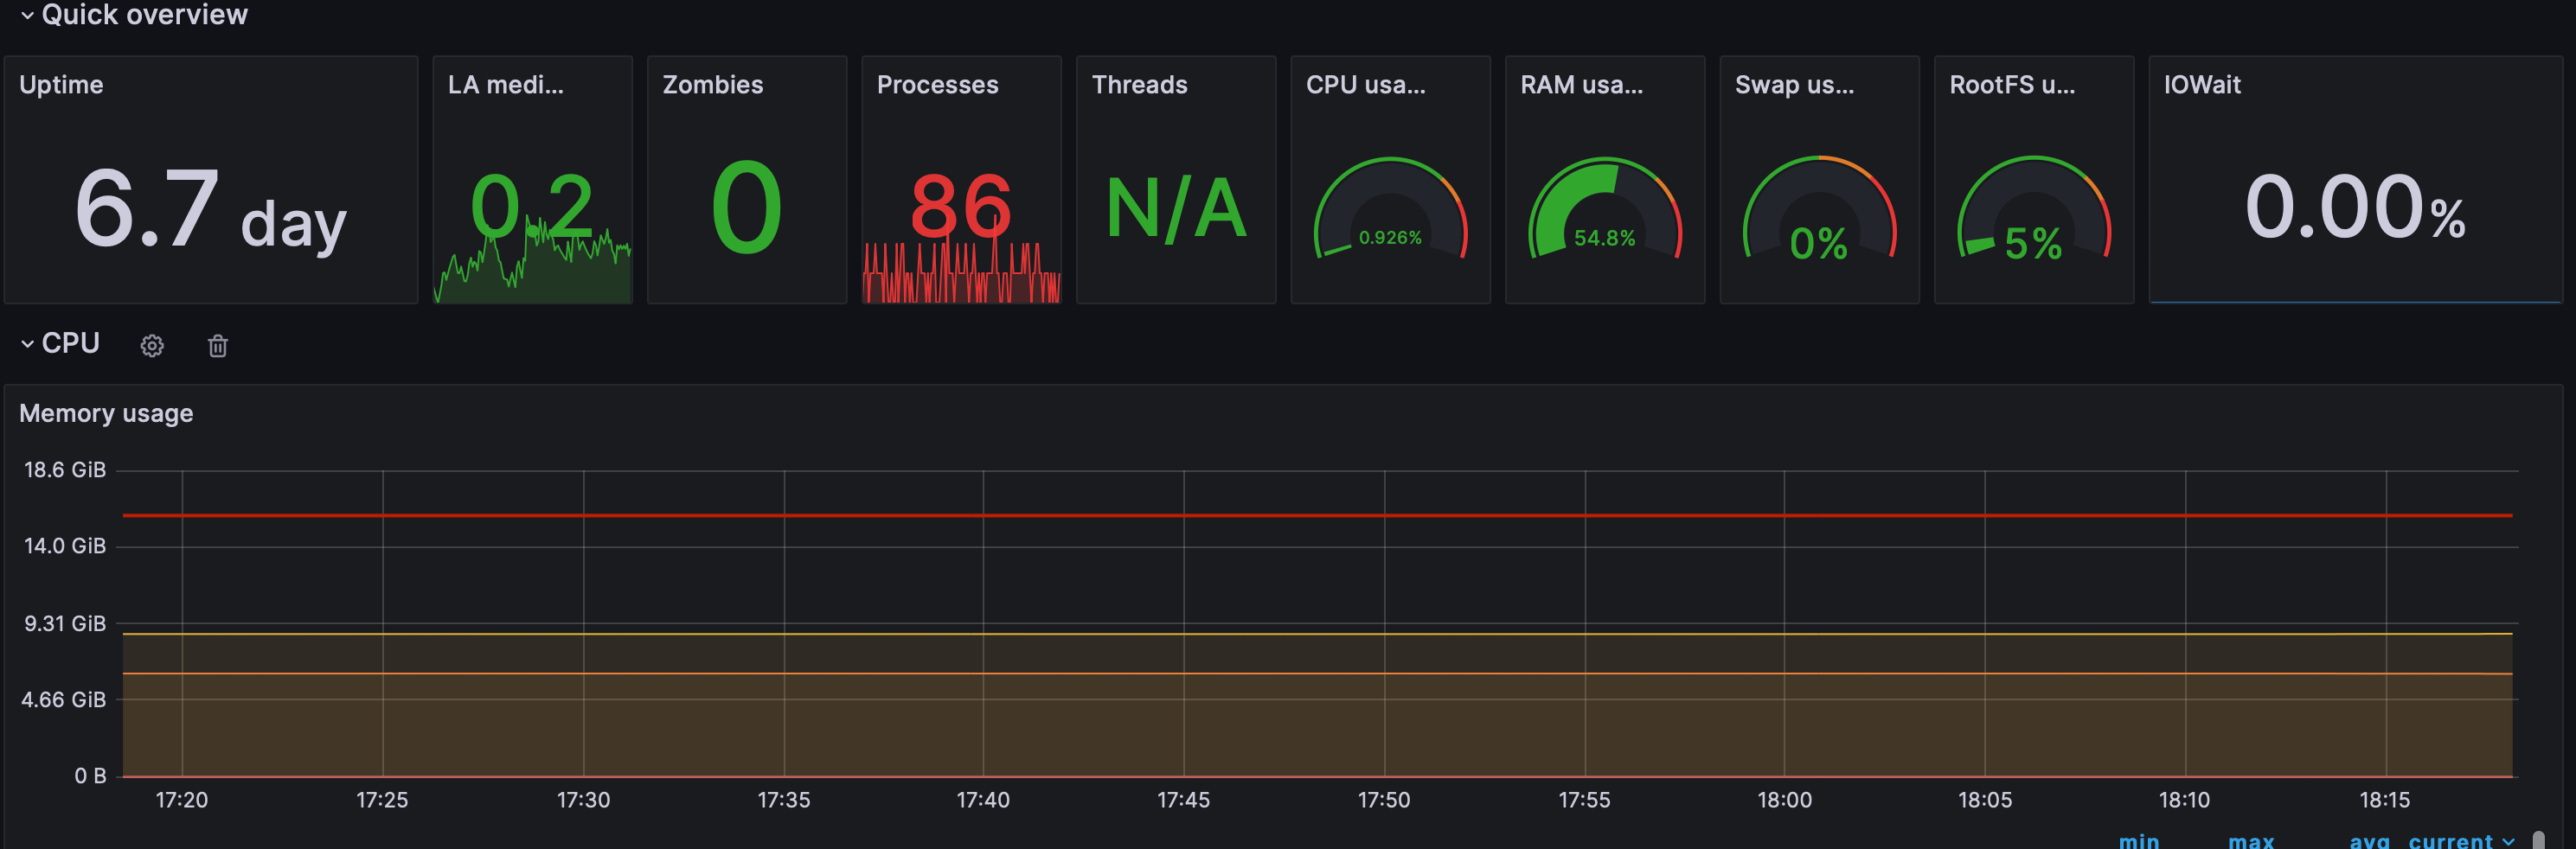
选择展示模版,这里通过导入已有模版的方式。我的模版效果如下,更多的可在官方模版库查找
选择合适的模版,并点击 Load 加载模版
模版加载之后选择对应的数据源,最终确认后的效果如下:
telegraf的安装和配置
-
查找 telegraf 包
1pkg search telegraf结果如下:
1telegraf-1.26.0_1 Time-series data collection -
安装
1pkg install telegraf-1.26.0_1 -
设置为随系统启动
1sysrc telegraf_enable="YES" -
修改配置文件
配置文件地址:
/usr/local/etc/telegraf.conf,在其中添加如下内容:1 2 3 4 5 6# 配置 influxdb连接内容,此处的内容和上面配置的 InfluxDB 数据库连接账号密码 [[outputs.influxdb]] urls = ["http://127.0.0.1:8086"] database = "my_db" username = "username" password = "password" -
启动服务
1service telegraf start